 |
|
|
|
|
| compas j2ee - running instructions | |
|
|
NOTE: For releases prior to 0.9.5, such as
0.90-end2end-beta, you need to follow the old installation and
running instructions, available
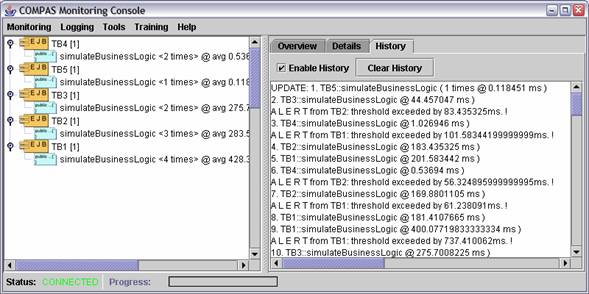
here. Before the COMPAS Client GUI can be run, you need to configure the environment. In addition, you need to instrument an application (the client would of course run without this but you would not see anything interesting in the consoles). Note: all the screenshots below have been obtained by instrumenting and monitoring an AdaptiveCells/J test-bed, which provided the flexibility required for different experiments (in particular adaptive monitoring techniques). COMPAS has however been tested with several off-the-shelf J2EE applications, such as Sun's Petstore or IBM's Trade3. The COMPAS Monitoring Console Execute run-compas.bat (on Windows) or run-compas.sh (on UNIX) to start the COMPAS GUI.
When the COMPAS Monitoring Console
first starts, it will look for already registered EJBs. If it finds
any, it will display them in the tree on the left hand side.
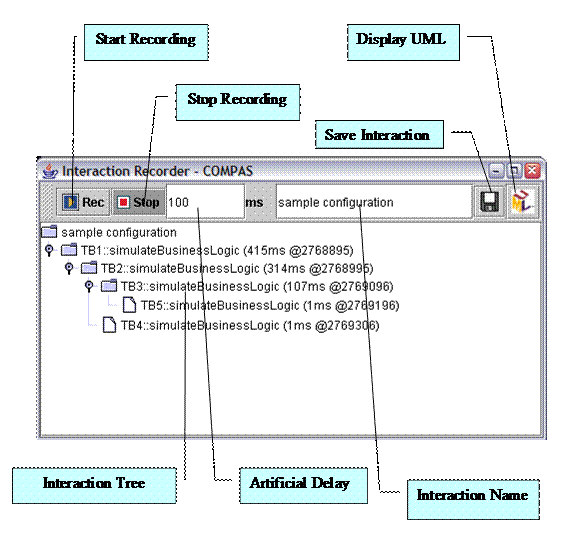
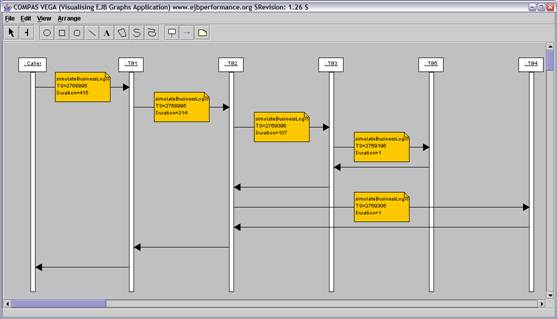
Recording, Displaying and Selecting Interactions In order to enable adaptive behaviour in the monitoring infrastructure, knowledge about the execution models must be obtained. To obtain execution models, COMPAS provides the Interaction Recorder, which is part of the main monitoring console and can be started using the Training -> Record Interactions menu option from the main monitoring console. The Interaction Recorder GUI, presented below can operate the recording process using a Recording button to start the capture of events and the Stop button to display the processed interaction tree.
The text field labelled
(ms) represents the number of milliseconds of delay that can be
induced in the EJBs in order to ensure that method invocations are
properly ordered. This is needed when the
environment accuracy of the timestamps is poor, such as when using
the default time-extraction strategy on a Windows machine. A useful value is 100ms but it can be adjusted by the user
to fit to the environment.
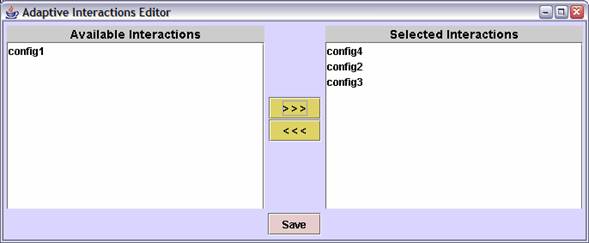
After interactions have been captured from the running system, they can be saved and used in the adaptation process. The user can select a subset of all saved interactions to be considered by the diagnosis and adaptation module. This is realised with the Adaptive Interactions Editor, shown below. The user can choose the required interactions and when the configuration is saved, the model knowledge is transmitted to the monitoring framework dynamically and becomes effective immediately.
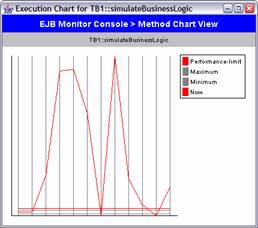
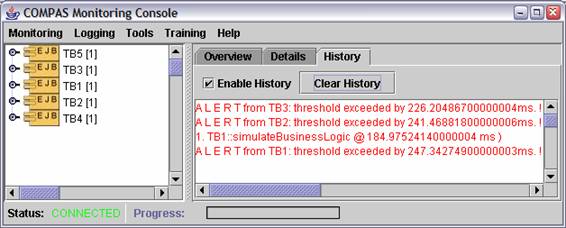
Having model knowledge helps in pinpointing performance hotspots. The screenshot below shows alerts being generated for some EJB methods (because their response time exceeded the configured threshold). Using recorded model information, the COMPAS console prints out the following message: “Method TB3::simulateBusinessLogic is hotspot!”.
More details on the adaptive functionality and COMPAS in general can be found in the papers referenced in the links section. |
|
© 2005 Adrian Mos |
|
